ElasticSearch Chart 的选择
在 https://artifacthub.io/ 上搜索 ES 的 Chart,排在前列的有 Elastic Elasticsearch 和 Bitnami Elasticsearch 两个版本
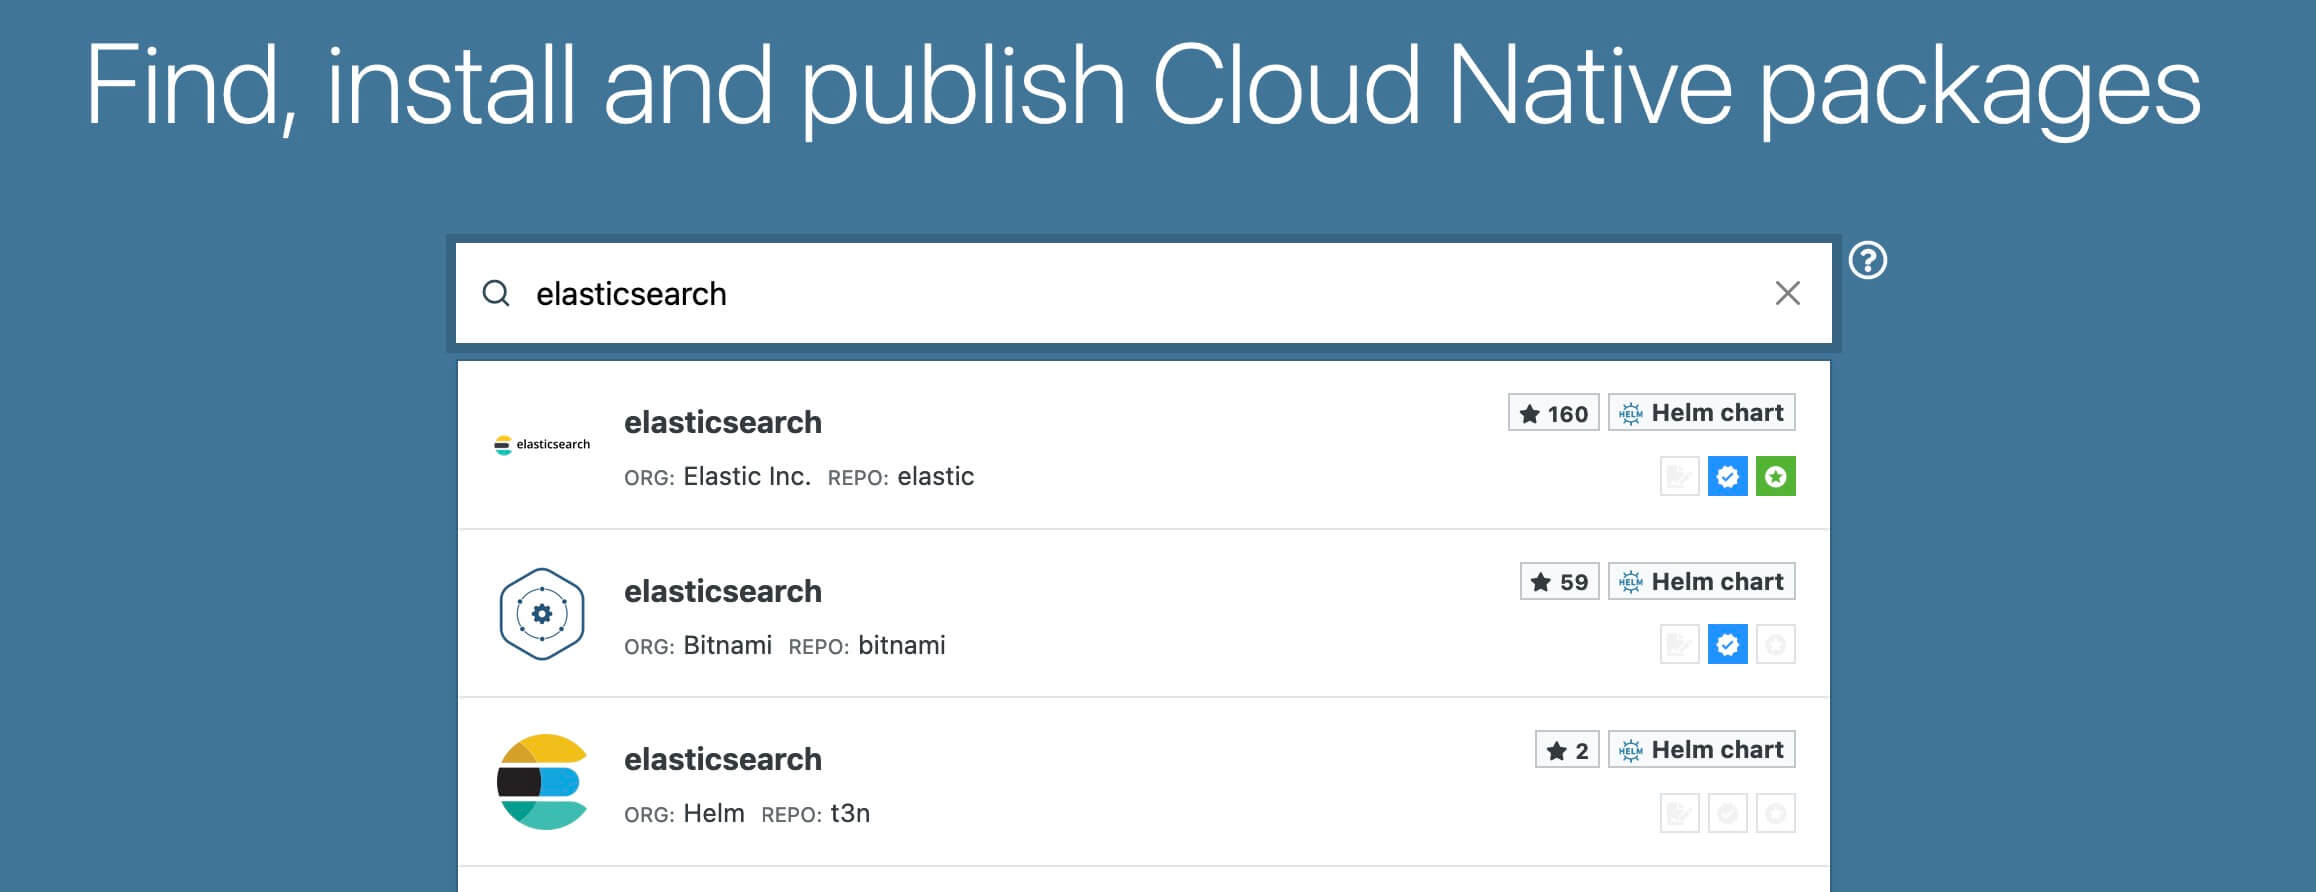
我先部署的 Elastic Elasticsearch 版本,Elastic 封装的 Chart 在变量设置上不方便使用,例如在测试环境,我希望通过 HTTP 访问服务和设置 SC,翻模版、查看变量找了一圈儿才跑起来;而安装 Bitnami 版本过程就很丝滑,推荐选择 Bitnami 社区制作的 Chart,更易用,同时其 ElasticSearch 版本也更高一些。
部署 Bitnami Elasticsearch
基础命令
$ helm install appserver-bitnami-elasticsearch bitnami/elasticsearch --version 21.0.2测试环境最小化安装,节省资源。
$ helm install bitnami-elasticsearch bitnami/elasticsearch --version 21.0.2 \
  --set-string global.storageClass=efs-sc \
  --set master.masterOnly=false \
  --set master.replicaCount=1 \
  --set data.replicaCount=0 \
  --set coordinating.replicaCount=0 \
  --set ingest.replicaCount=0 \
  --set-string master.nodeSelector.platform=true \
  -n common
指定存储的 SC、关闭 masterOnly ,即 data 等组件可以跟 master 运行在一个服务中,节省资源,另外设置 master.nodeSelector 调整部署的节点。
删除命令
$ helm uninstall bitnami-elasticsearch -n common访问测试
$ curl -X GET http://bitnami-elasticsearch:9200输出
{
  "name" : "bitnami-elasticsearch-master-0",
  "cluster_name" : "elastic",
  "cluster_uuid" : "lN17q_c0Rc-6r13TlBEJUA",
  "version" : {
    "number" : "8.13.3",
    "build_flavor" : "default",
    "build_type" : "tar",
    "build_hash" : "617f7b76c4ebcb5a7f1e70d409a99c437c896aea",
    "build_date" : "2024-04-29T22:05:16.051731935Z",
    "build_snapshot" : false,
    "lucene_version" : "9.10.0",
    "minimum_wire_compatibility_version" : "7.17.0",
    "minimum_index_compatibility_version" : "7.0.0"
  },
  "tagline" : "You Know, for Search"
}
健康检查
$ curl -X GET "http://bitnami-elasticsearch:9200/_cluster/health" 输出
{"cluster_name":"elastic","status":"green","timed_out":false,"number_of_nodes":1,"number_of_data_nodes":1,"active_primary_shards":0,"active_shards":0,"relocating_shards":0,"initializing_shards":0,"unassigned_shards":0,"delayed_unassigned_shards":0,"number_of_pending_tasks":0,"number_of_in_flight_fetch":0,"task_max_waiting_in_queue_millis":0,"active_shards_percent_as_number":100.0}部署 Elastic Elasticsearch
如果你参考了 Bitnami 部署 Elasticsearch,请跳过本小节,本小节的部署示例仅用于记录 Elastic 版的部署方式。
先创建一个变量配置文件,需设置 createCert 为 false,如果不关闭,那么在 Template 中根据 createCert 写死了 Elasticsearch 的安全配置,会强制开启 HTTPS 访问(这里也有提及这一情况,他解决的方式是修改 Template 模版),关闭后 protocol 变量需要同步修改为 http,esConfig 中将安全开关都关闭(关闭安全选项并非最佳实践)
security-values.yml
---
clusterName: "elasticsearch"
nodeGroup: "master"

createCert: false

roles:
  - master
  - ingest
  - data

protocol: http

esConfig:
  elasticsearch.yml: |
    cluster.name: "myelasticsearch"
    network.host: 0.0.0.0
    xpack.security.enabled: false
    xpack.security.transport.ssl.enabled: false
    xpack.security.http.ssl.enabled: false
设置 xpack.security.http.ssl.enabled 为 false,即可通过 HTTP 访问 9200 端口,那为什么我将 xpack.security.enabled 和 xpack.security.transport.ssl.enabled 也关闭了呢?
这是因为 createCert 已被设置为 false,但是设置 false 后不能自动生成证书,不关闭也无法正常使用 —— 即 xpack.security.http.ssl.enabled 无法独立关闭。
启动服务
$ helm install testing-elasticsearch-master elastic/elasticsearch --version 8.5.1 \
  --set-string fullnameOverride=testing-elasticsearch-master \
  --set-string persistence.enabled=true \
  --set volumeClaimTemplate.accessModes[0]="ReadWriteOnce" \
  --set volumeClaimTemplate.resources.requests.storage=35Gi \
  --set-string volumeClaimTemplate.storageClassName=efs-sc \
  --set replicas=2 \
  --set-string nodeSelector.platform=true \
  -f security-values.yml \
  -n common
注意:测试的时候发现,replicas 最小只能设置为 2,设置为 1 后启动不了,另外如果不设置 fullnameOverride,则 Helm 安装后的服务叫 elasticsearch-master,是由 clusterName + nodeGroup 组成的。
备忘:通过 HTTP 协议访问接口报错内容如下:
{"@timestamp":"2024-05-09T06:20:17.790Z", "log.level": "WARN", "message":"received plaintext http traffic on an https channel, closing connection Netty4HttpChannel{localAddress=/10.10.58.175:9200, remoteAddress=/10.10.2.234:52244}", "ecs.version": "1.2.0","service.name":"ES_ECS","event.dataset":"elasticsearch.server","process.thread.name":"elasticsearch[elasticsearch-master-1][transport_worker][T#1]","log.logger":"org.elasticsearch.xpack.security.transport.netty4.SecurityNetty4HttpServerTransport","elasticsearch.cluster.uuid":"kPDKL67vTLeBvUhCucohxw","elasticsearch.node.id":"u1tE7zJ-Sk69c8iDUNehkA","elasticsearch.node.name":"elasticsearch-master-1","elasticsearch.cluster.name":"elasticsearch"}获取密码
$ kubectl get secrets --namespace=common testing-elasticsearch-master-credentials -ojsonpath='{.data.password}' | base64 -d从如上记录也可以看到,Elastic 版相较于 Bitnami 版部署会更困难些,也许更安全?Maybe
测试环境,我会选择 Bitnami 版的 ElasticSearch
访问测试
$ curl -X GET http://testing-elasticsearch-master:9200输出
{
  "name" : "testing-elasticsearch-master-0",
  "cluster_name" : "elasticsearch",
  "cluster_uuid" : "Z7e3gJQ4S_Ot_i_ReNctvQ",
  "version" : {
    "number" : "8.5.1",
    "build_flavor" : "default",
    "build_type" : "docker",
    "build_hash" : "c1310c45fc534583afe2c1c03046491efba2bba2",
    "build_date" : "2022-11-09T21:02:20.169855900Z",
    "build_snapshot" : false,
    "lucene_version" : "9.4.1",
    "minimum_wire_compatibility_version" : "7.17.0",
    "minimum_index_compatibility_version" : "7.0.0"
  },
  "tagline" : "You Know, for Search"
}
健康检查
$ curl -X GET "http://testing-elasticsearch-master:9200/_cluster/health" 输出
{"cluster_name":"elasticsearch","status":"green","timed_out":false,"number_of_nodes":3,"number_of_data_nodes":3,"active_primary_shards":1,"active_shards":2,"relocating_shards":0,"initializing_shards":0,"unassigned_shards":0,"delayed_unassigned_shards":0,"number_of_pending_tasks":0,"number_of_in_flight_fetch":0,"task_max_waiting_in_queue_millis":0,"active_shards_percent_as_number":100.0}部署 Kibana 面板
启动服务
$ helm install appserver-kibana bitnami/kibana --version 11.0.5 \
  --set-string global.storageClass=efs-sc \
  --set elasticsearch.hosts[0]=bitnami-elasticsearch \
  --set elasticsearch.port=9200 \
  --set-string nodeSelector.platform=true \
  -n common
删除服务
$ helm uninstall appserver-kibana -n common健康检查
/ # curl -I appserver-kibana:5601/status
HTTP/1.1 200 OK
x-content-type-options: nosniff
referrer-policy: strict-origin-when-cross-origin
permissions-policy: camera=(), display-capture=(), fullscreen=(self), geolocation=(), microphone=(), web-share=()
cross-origin-opener-policy: same-origin
content-security-policy: script-src 'report-sample' 'self'; worker-src 'report-sample' 'self' blob:; style-src 'report-sample' 'self' 'unsafe-inline'
kbn-name: appserver-kibana-5466c99b8d-h7lt7
kbn-license-sig: cf15298b2439c71055026ef4f9cae96e05b766cec95d831c243cb6587dbb3cd9
content-type: text/html; charset=utf-8
cache-control: private, no-cache, no-store, must-revalidate
content-length: 206865
vary: accept-encoding
Date: Thu, 09 May 2024 09:48:09 GMT
Connection: keep-alive
Keep-Alive: timeout=120
创建索引及查询测试
新建索引,名为 user_data
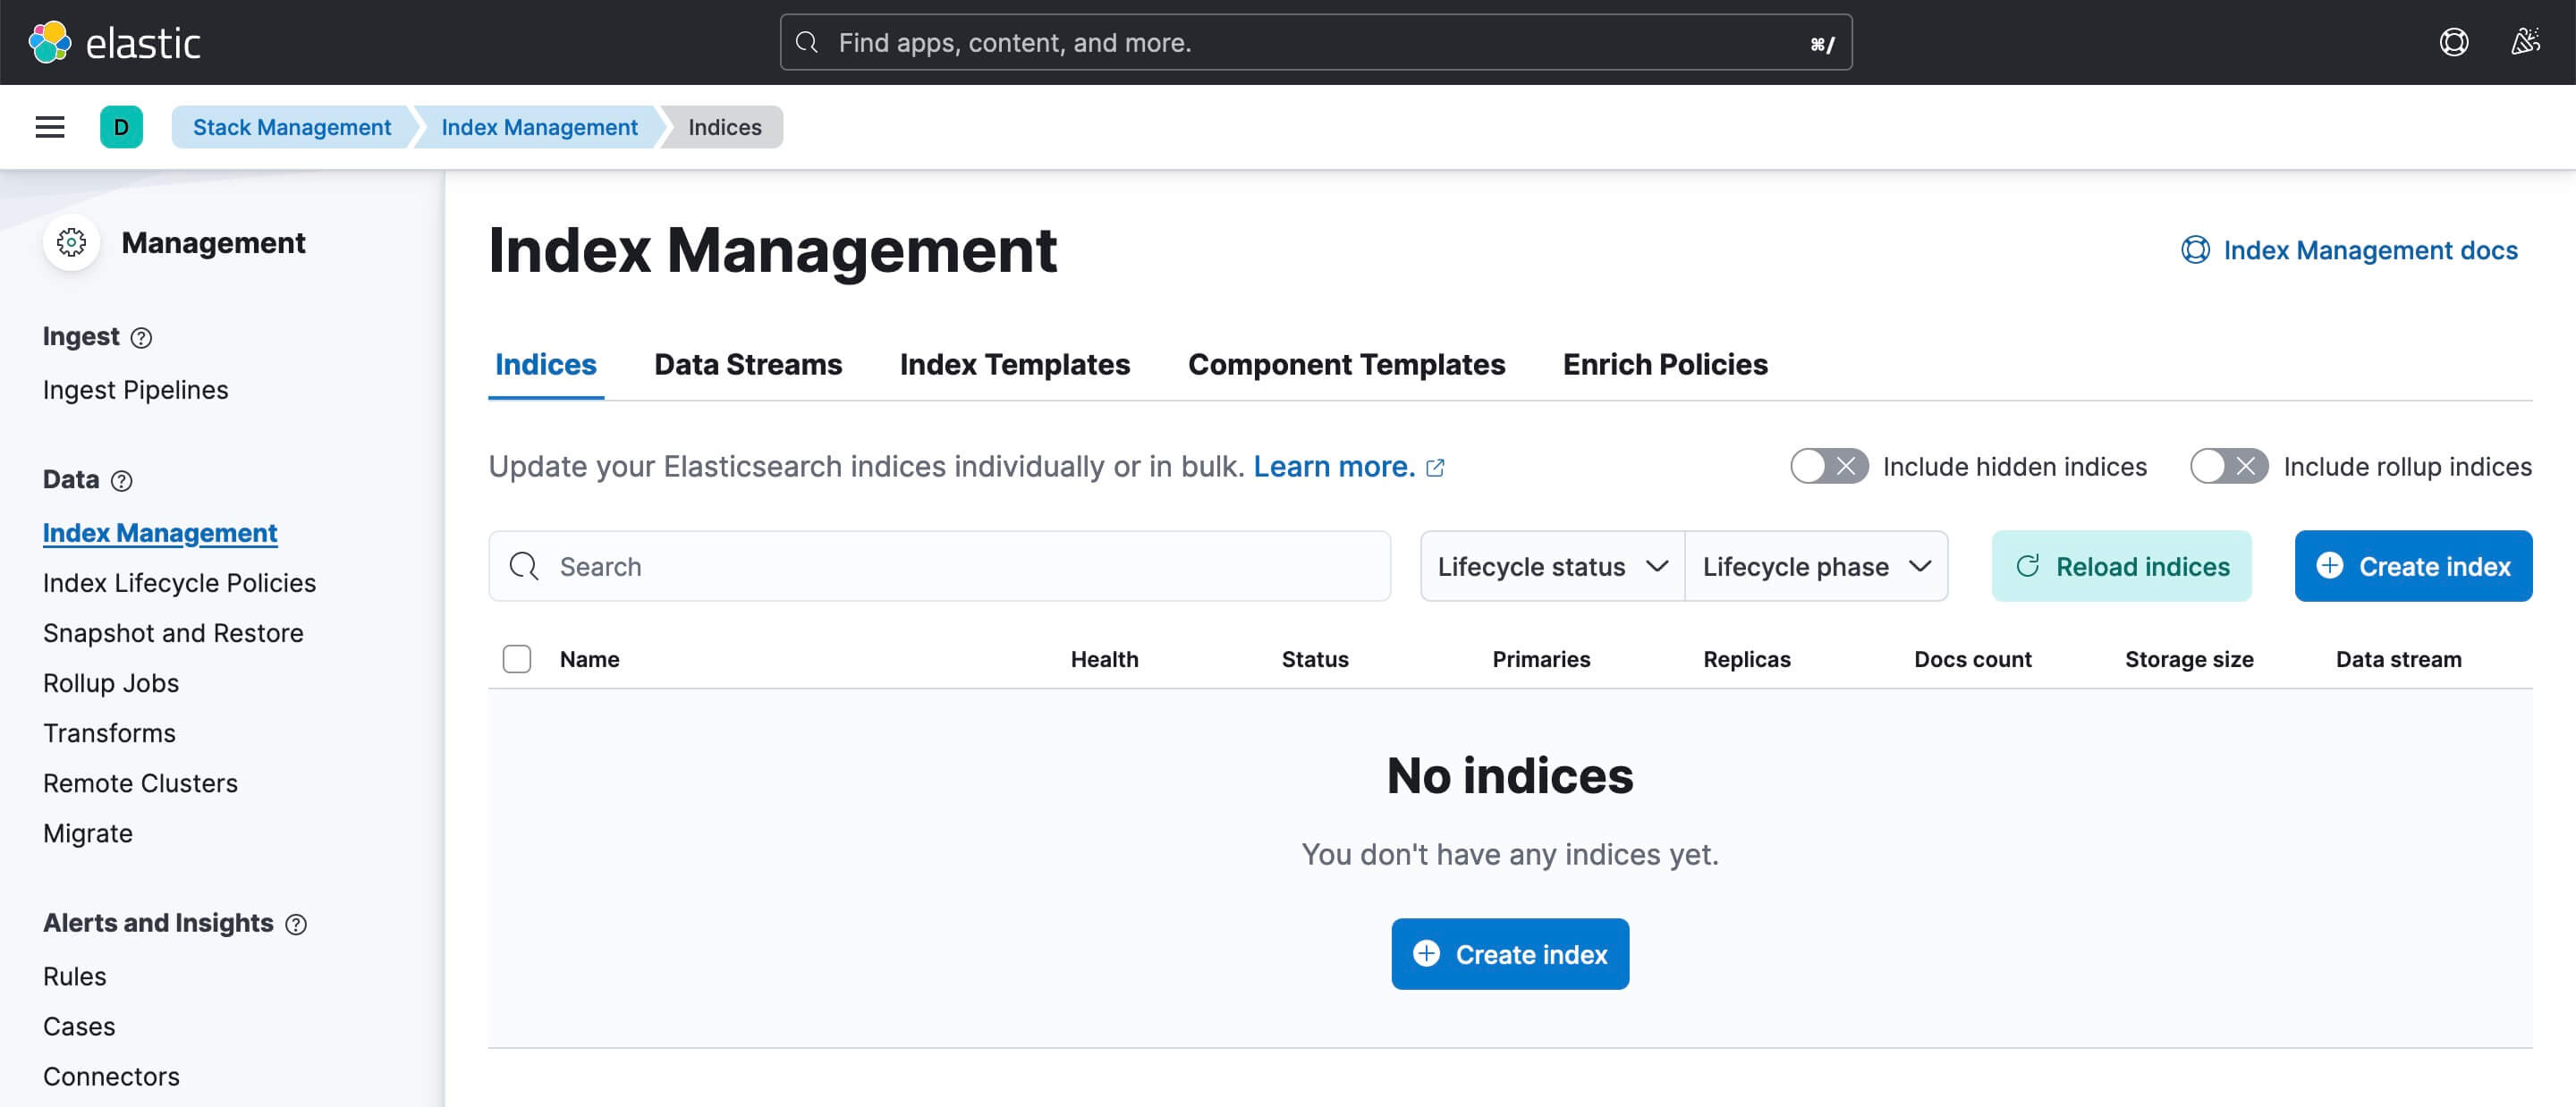
进入索引详情,打开执行面板
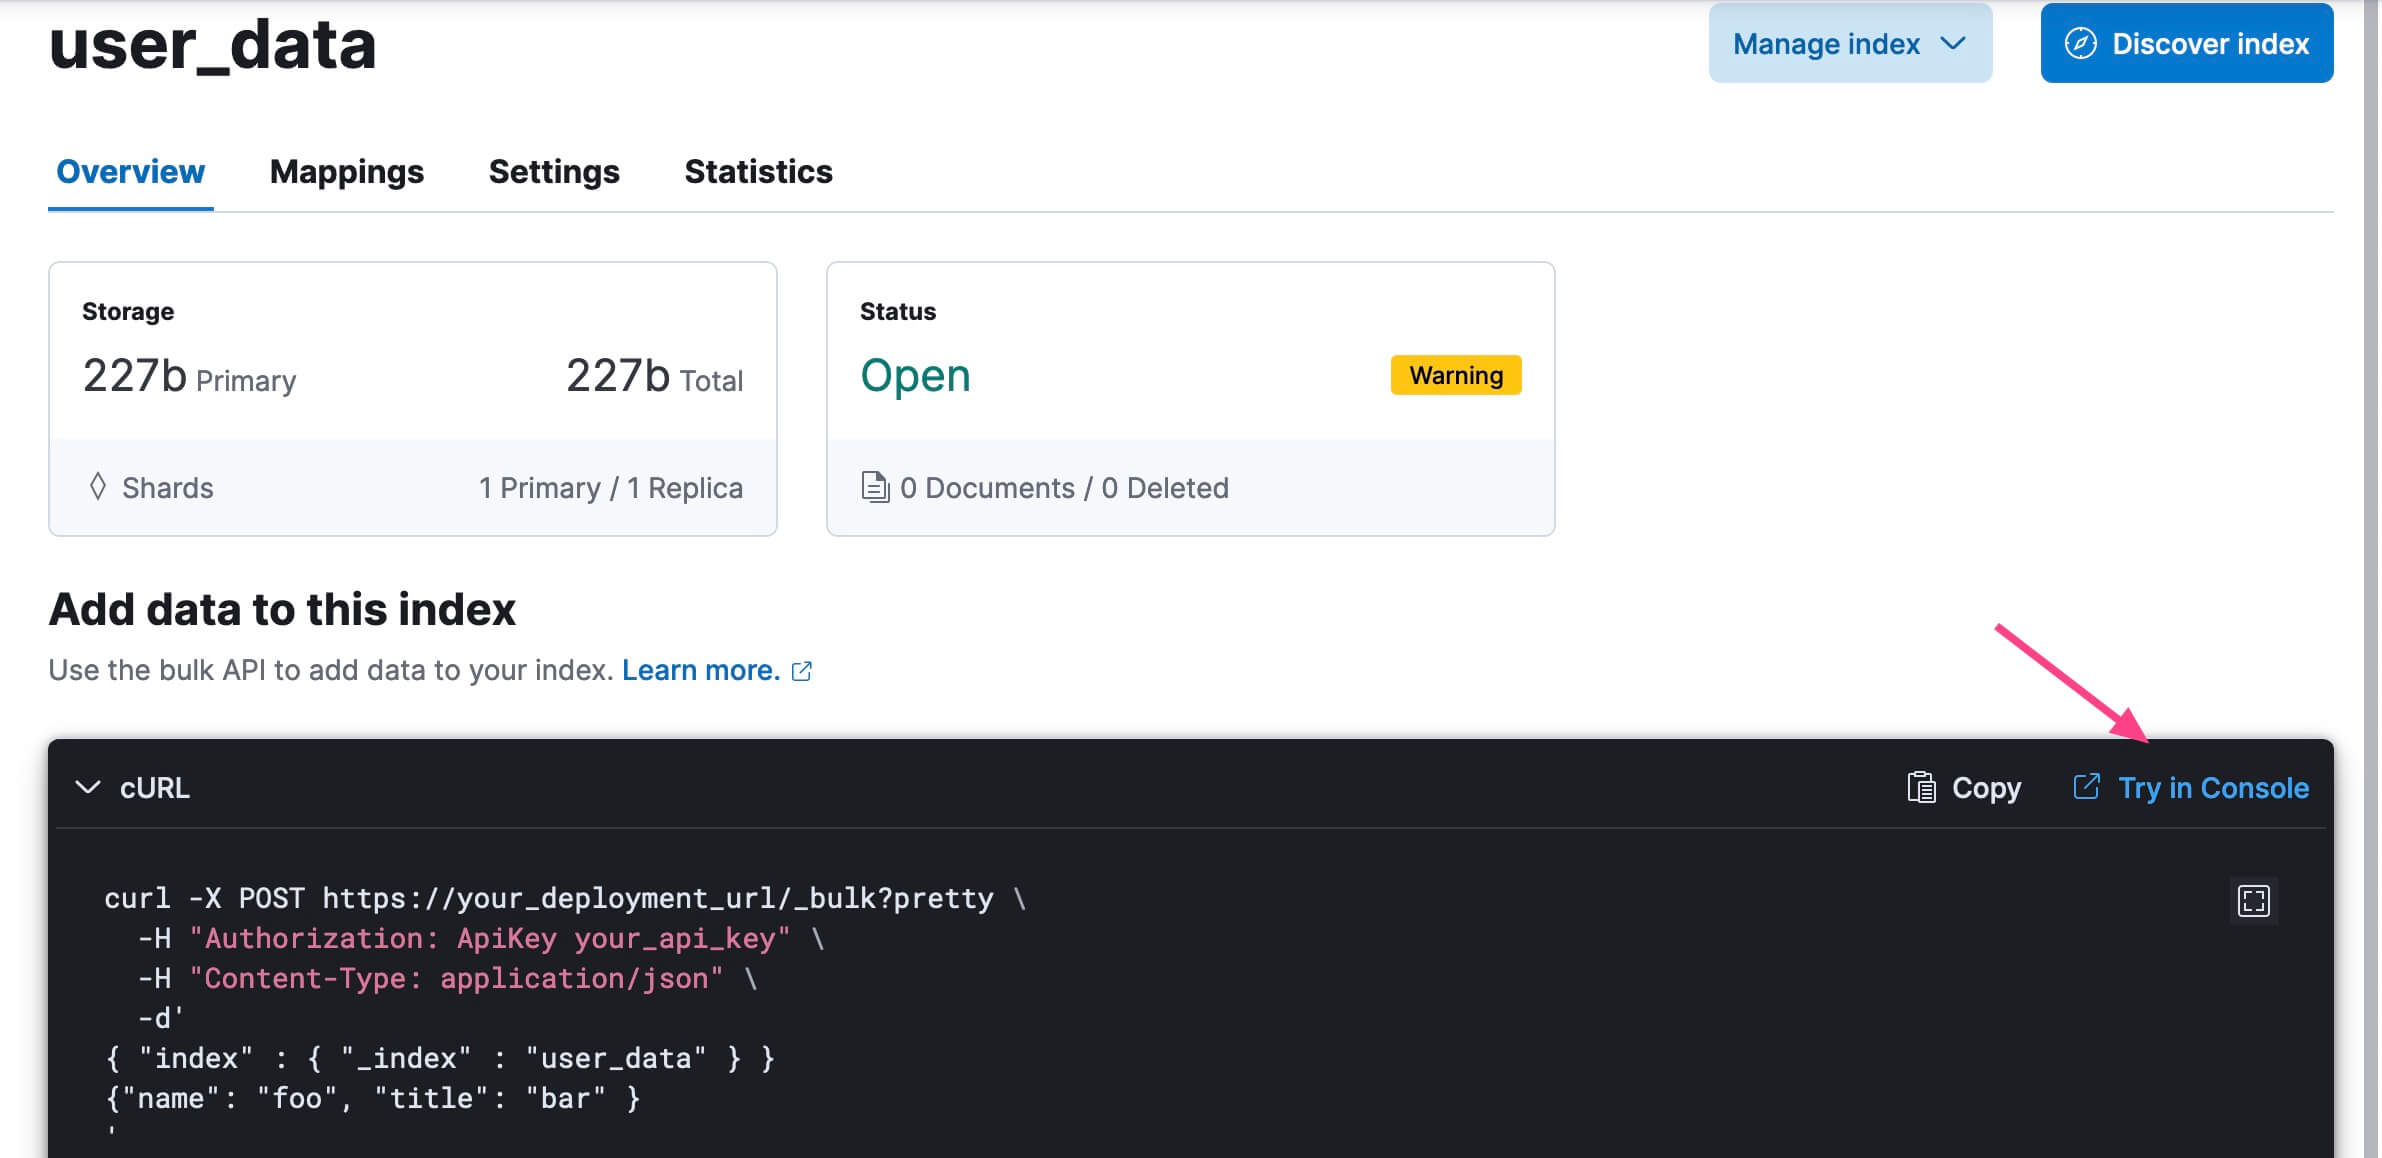
POST _bulk?pretty
{ "index" : { "_index" : "user_data" } }
{"name": "foo", "title": "bar"}
提交执行
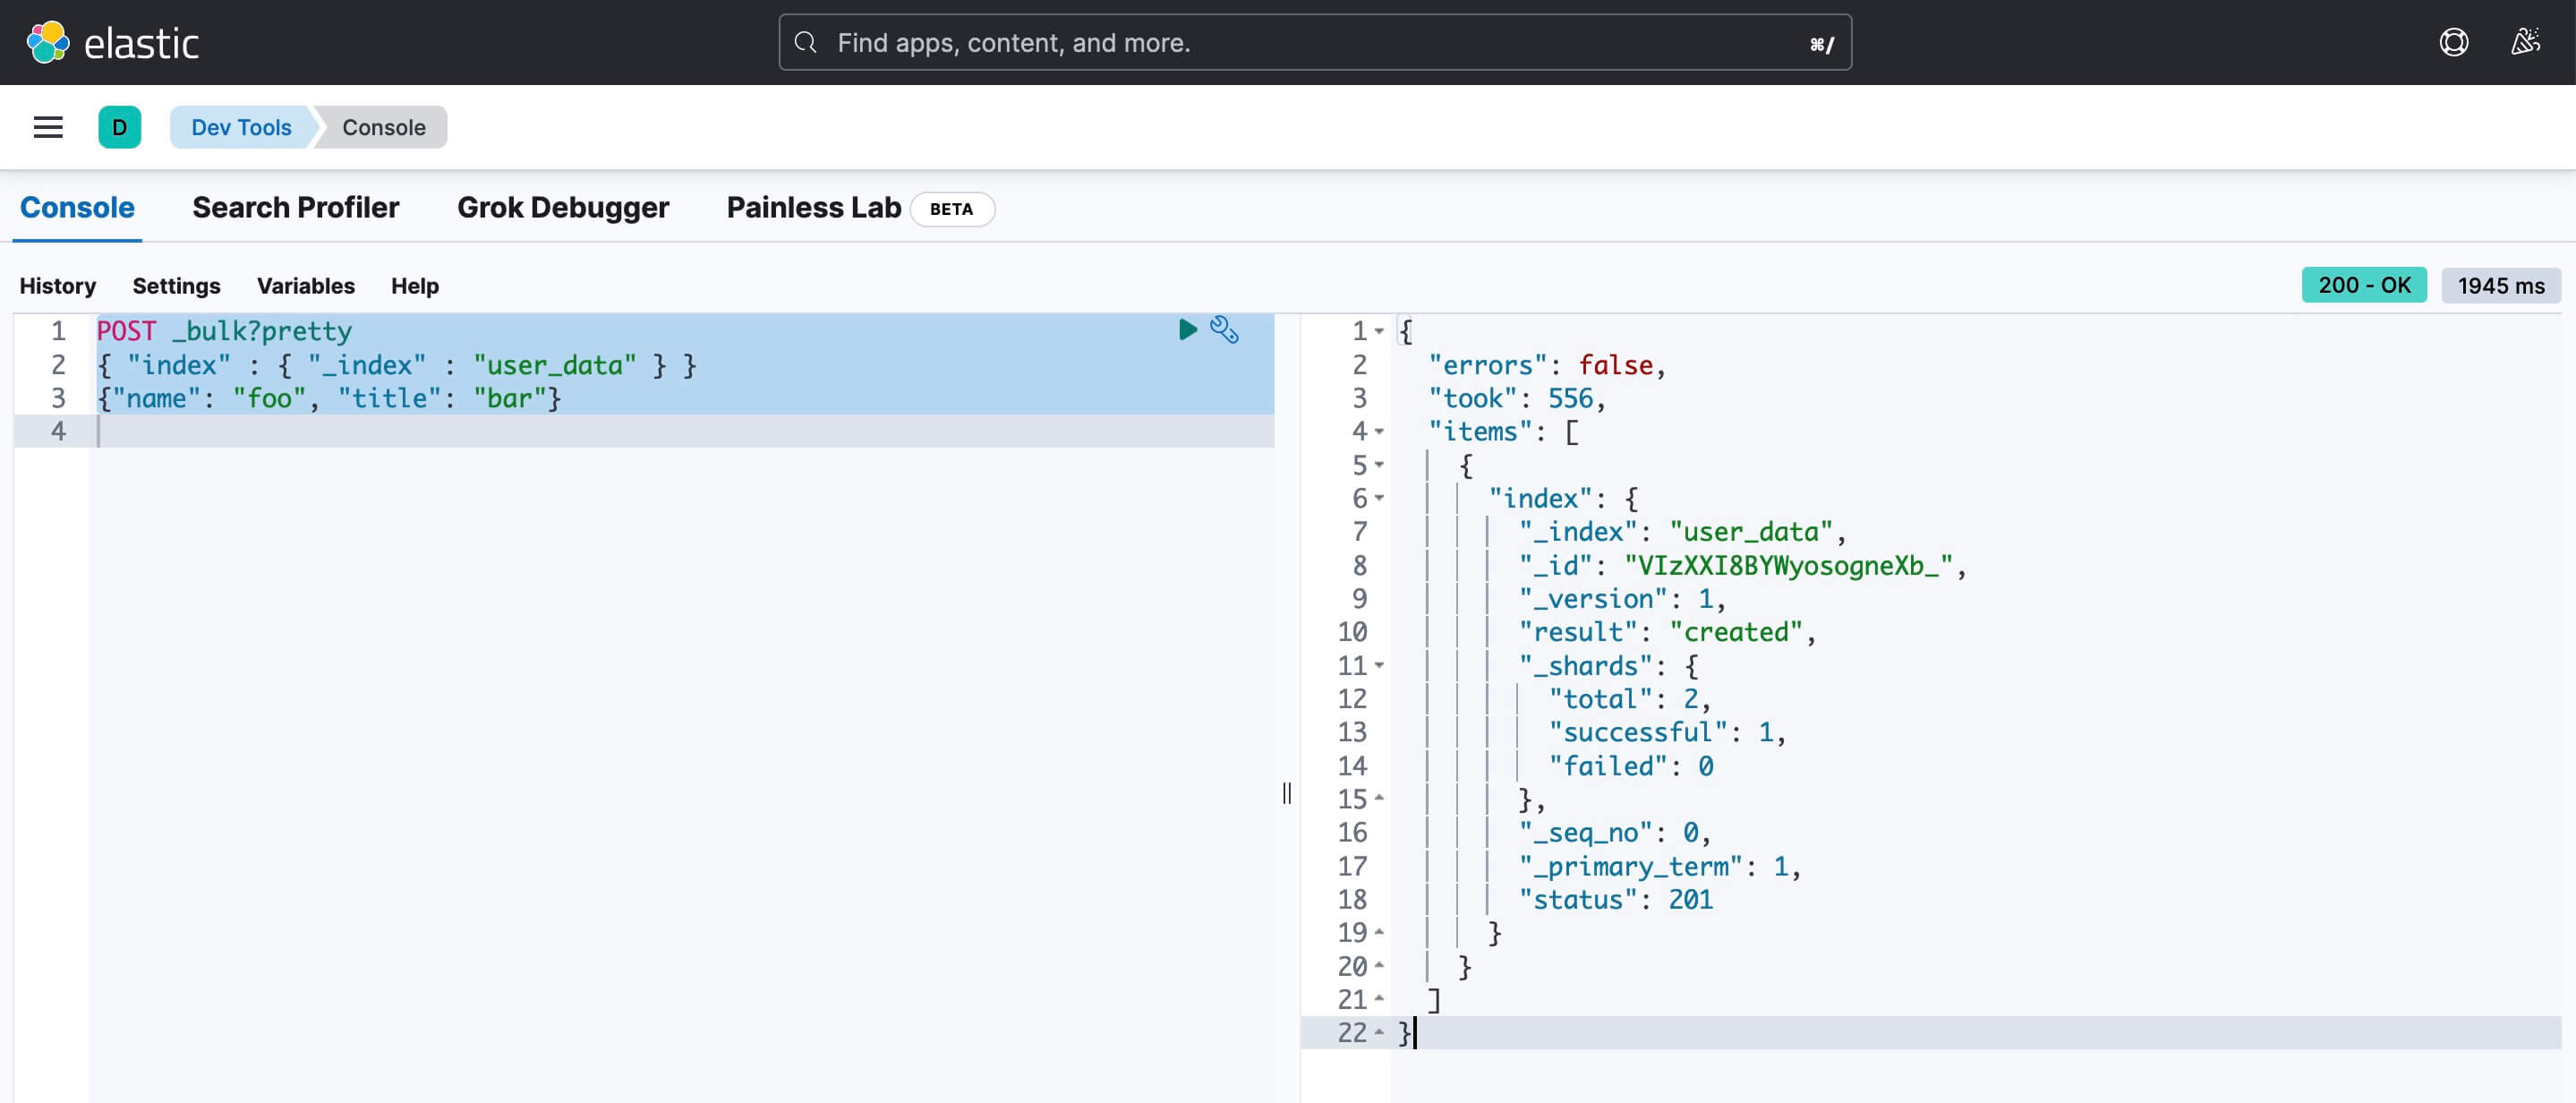
再输入以下命令进行查询
GET _search
{
  "query": {
    "match_all": {}
  }
}
结果
{
"took": 9,
"timed_out": false,
"_shards": {
"total": 14,
"successful": 14,
"skipped": 0,
"failed": 0
},
"hits": {
"total": {
"value": 1,
"relation": "eq"
},
"max_score": 1,
"hits": [
{
"_index": "user_data",
"_id": "VIzXXI8BYWyosogneXb_",
"_score": 1,
"_source": {
"name": "foo",
"title": "bar"
}
}
]
}
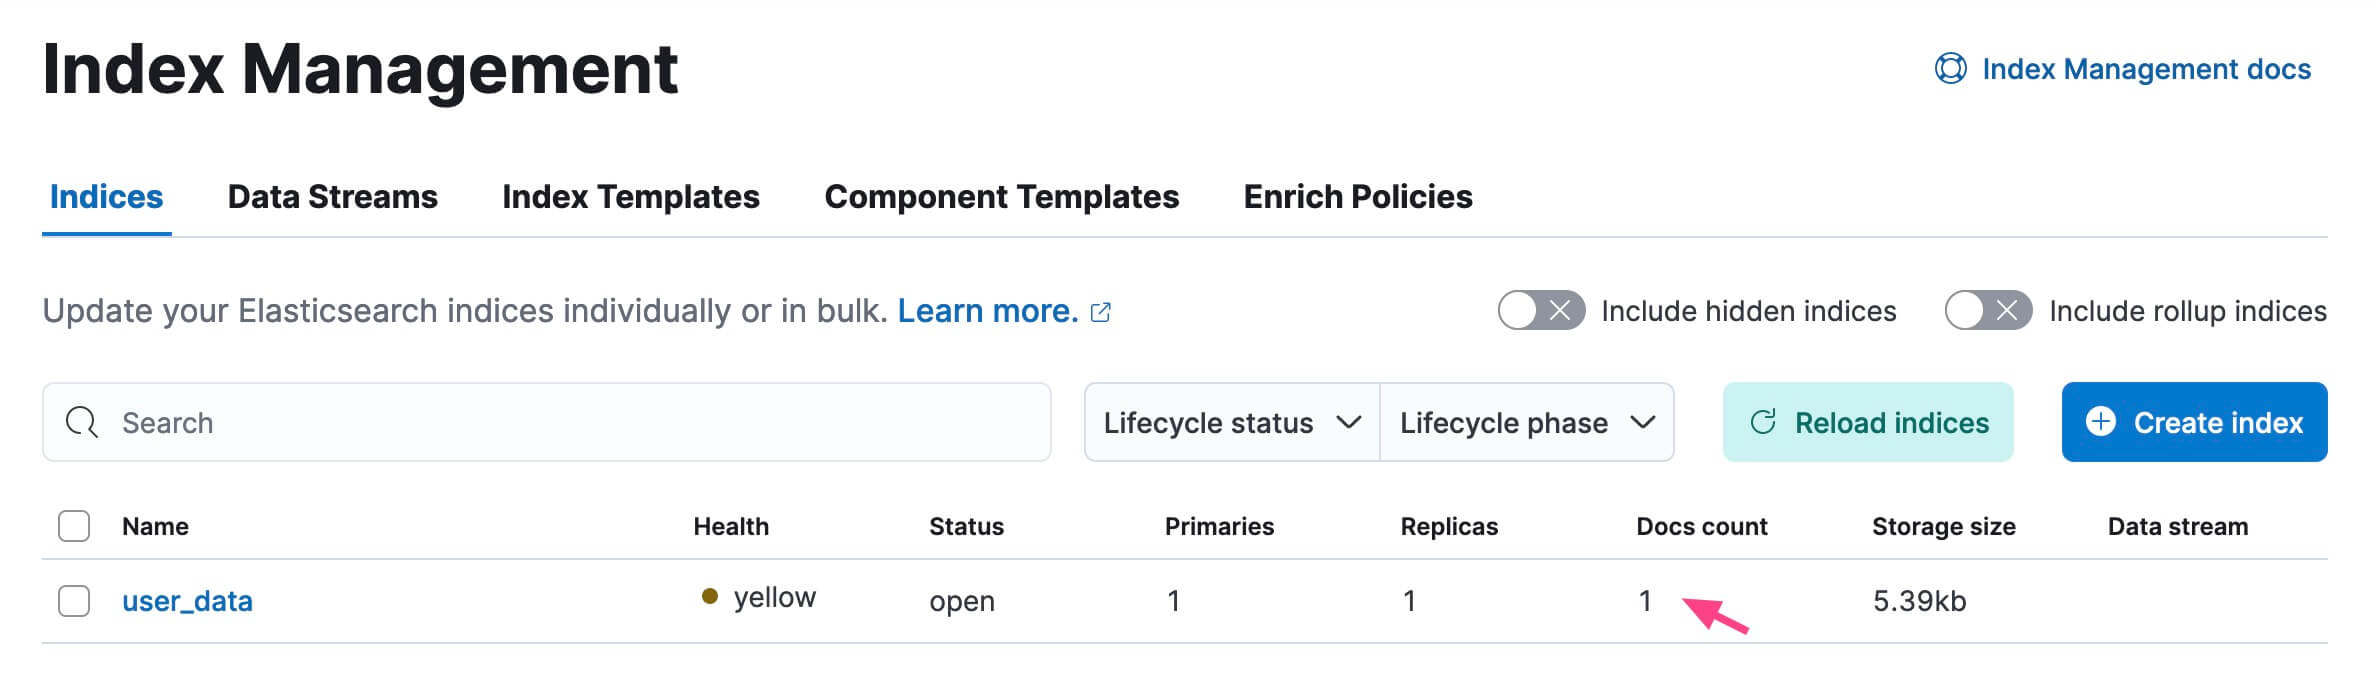
}此时,回到刚刚创建的索引可以看到已插入一条记录
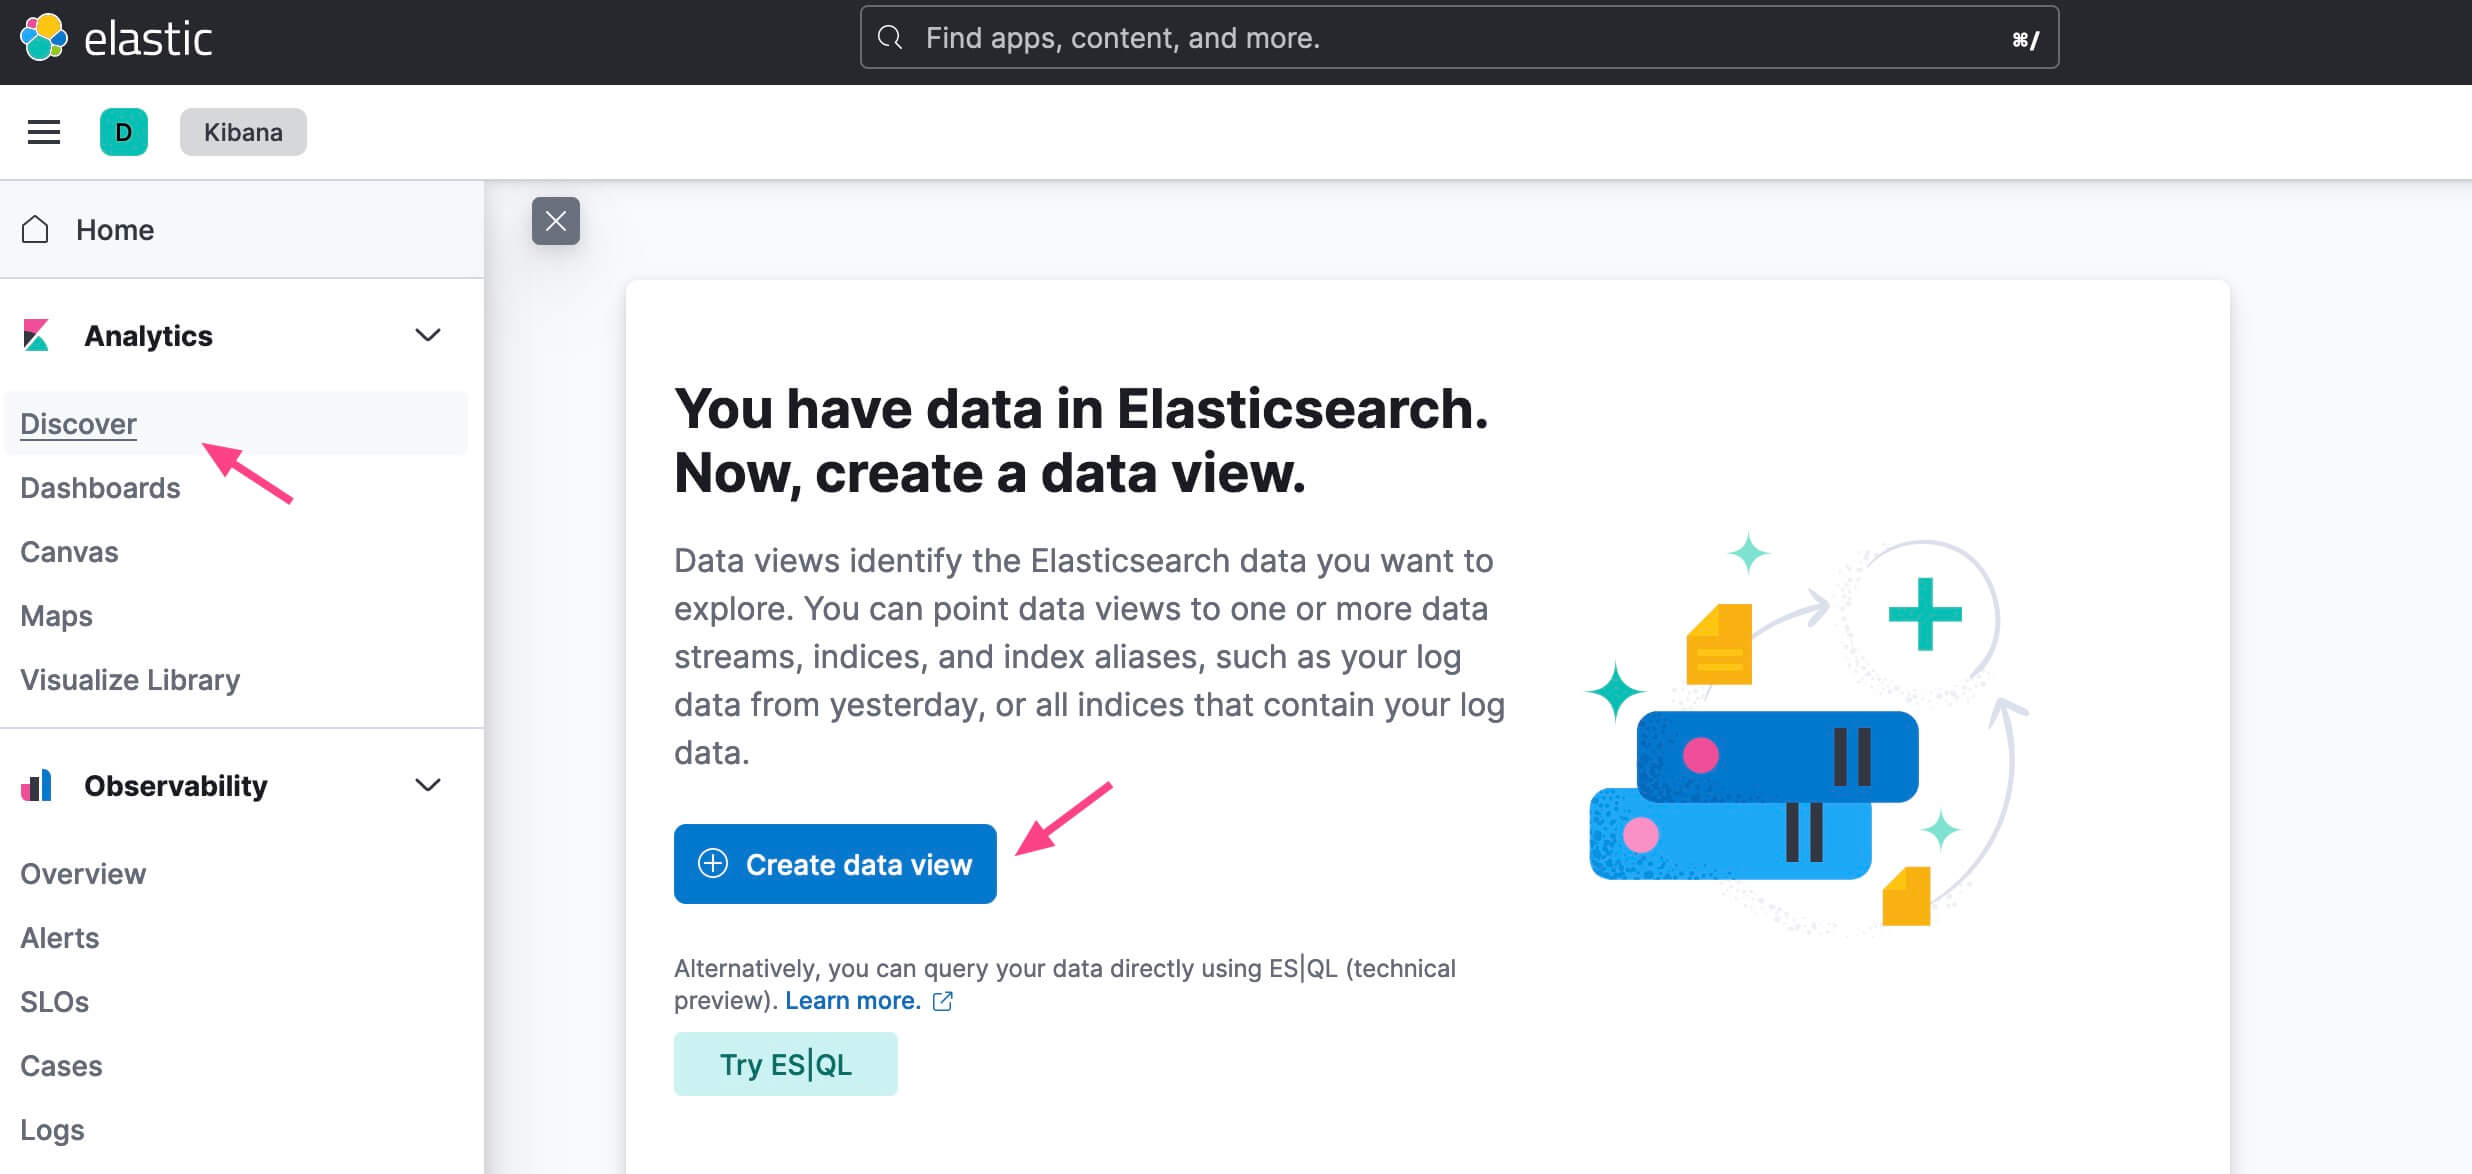
接下来从 Discover 浏览数据,点击 “Create data view” 按钮创建一个数据视图
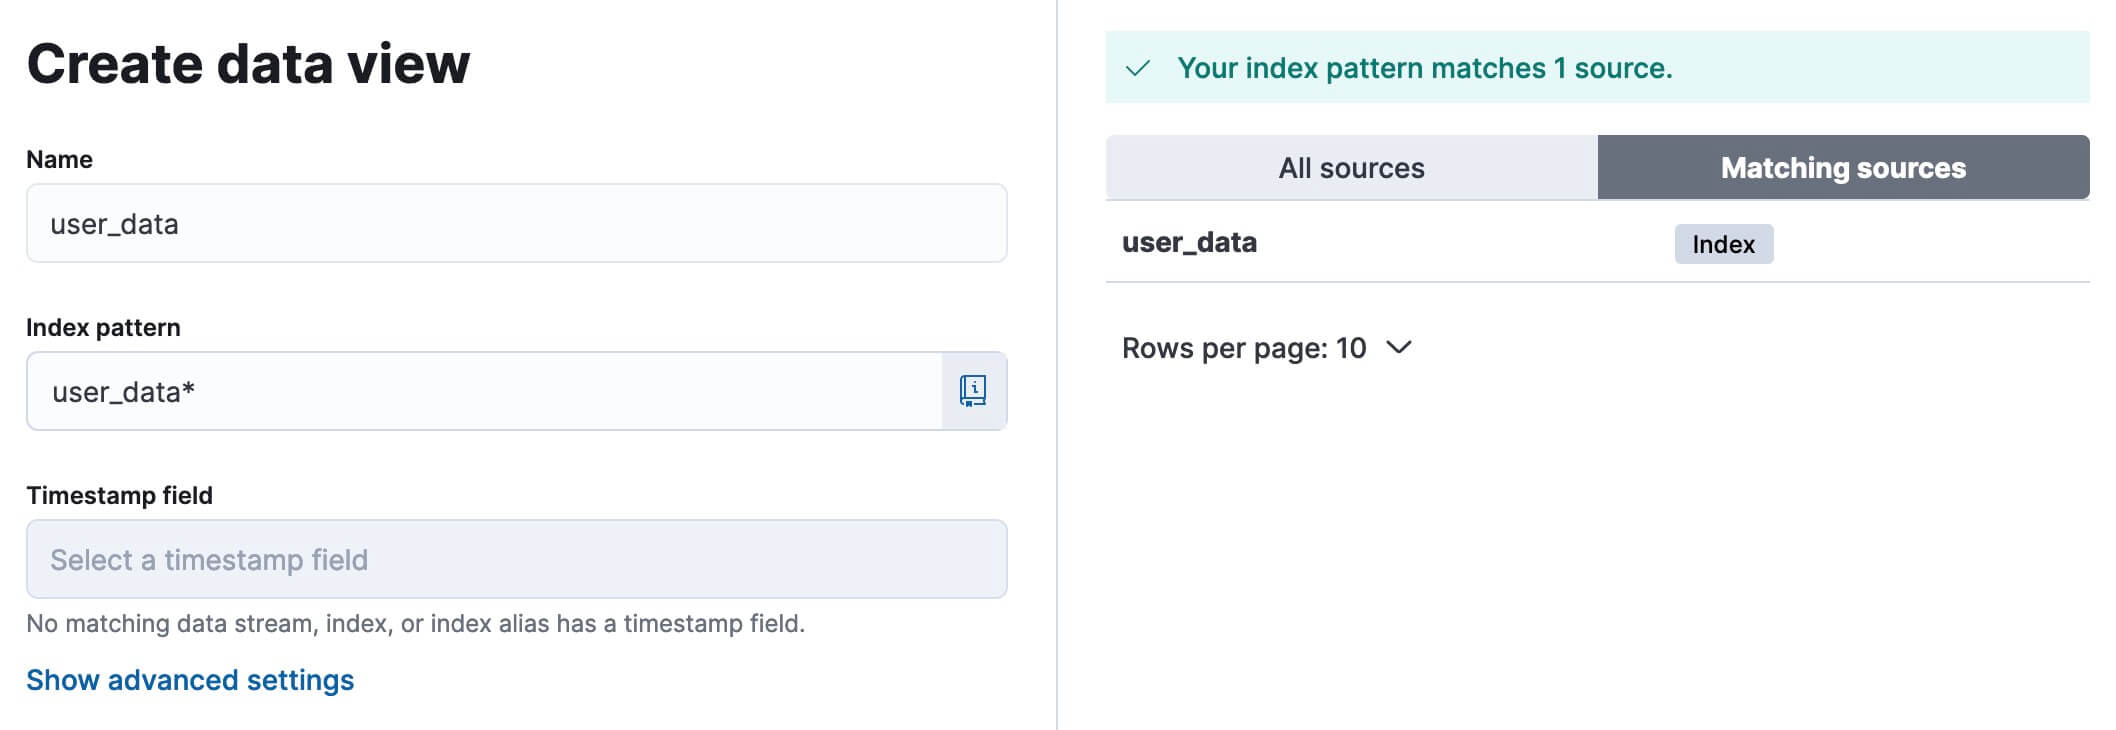
填写内容后可以看到匹配的 Index 索引,确认无误后保存
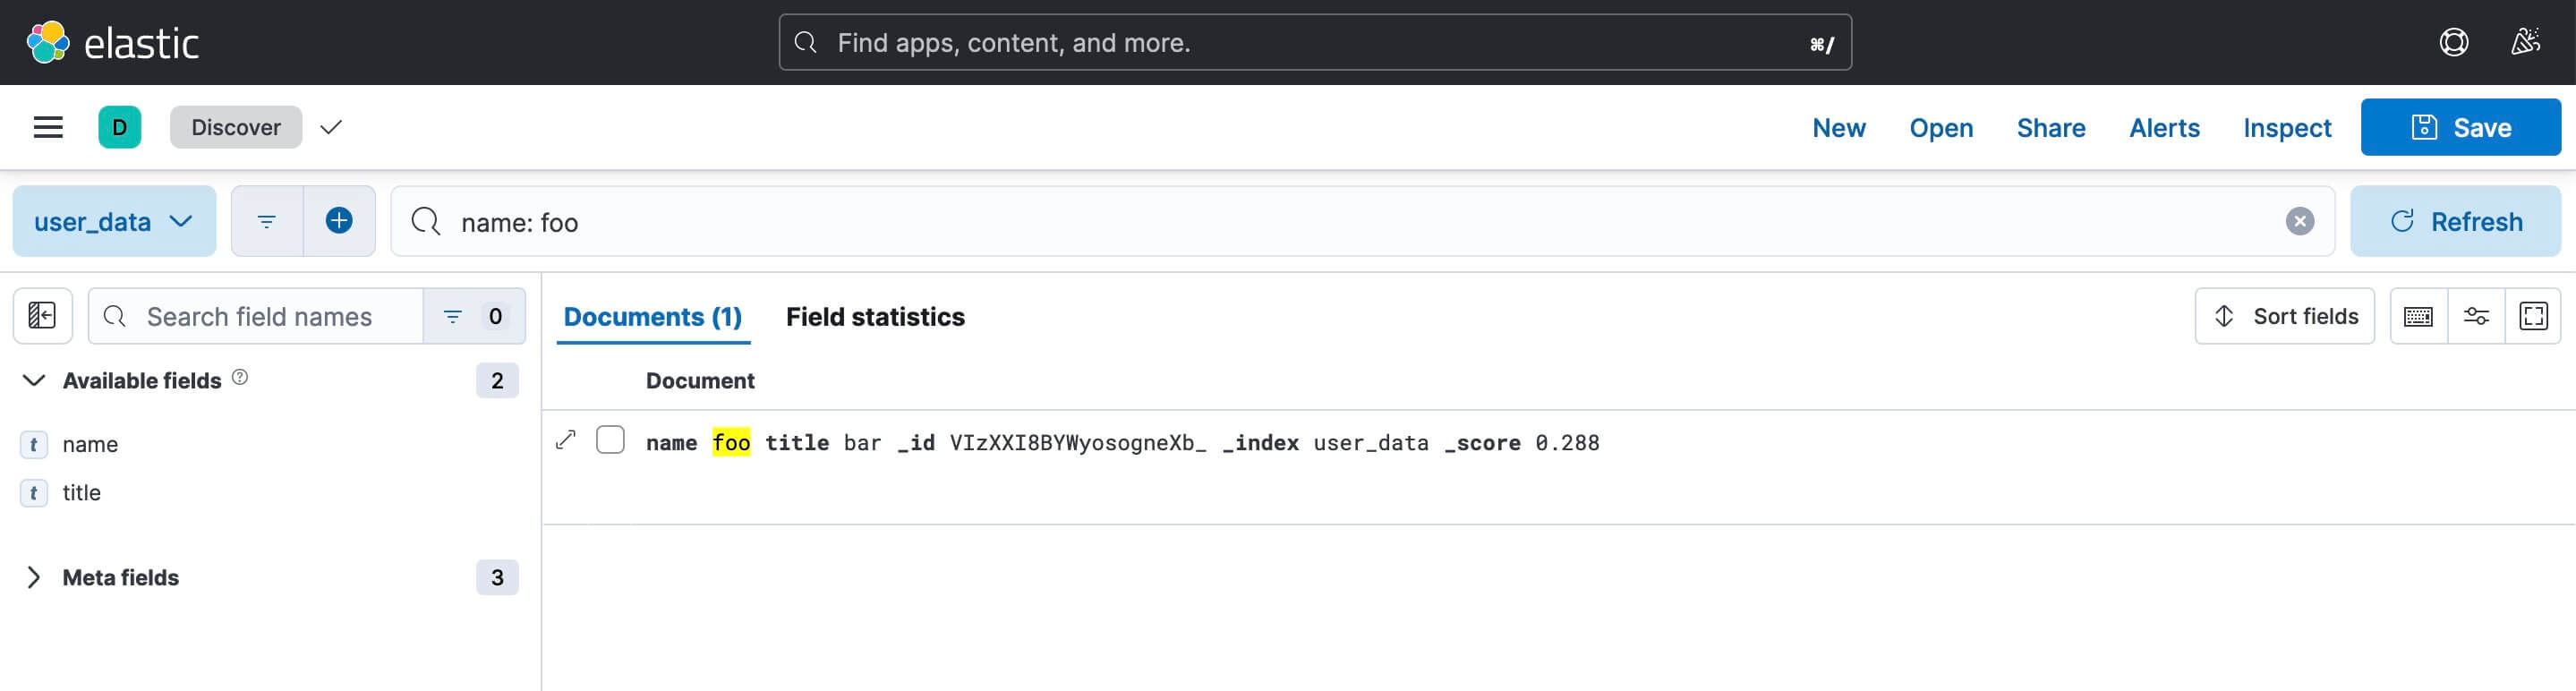
之后即可浏览、检索数据
从 ES 接口查询数据
从 Kibana 看到数据,我们也可以在集群中直接调用 ElasticSearch 的接口进行查询,命令如下
$ curl -X GET "http://bitnami-elasticsearch:9200/user_data/_search" -H 'Content-Type: application/json' -d'
{
  "query": {
    "match_all": {}
  },
  "size": 5
}'
输出
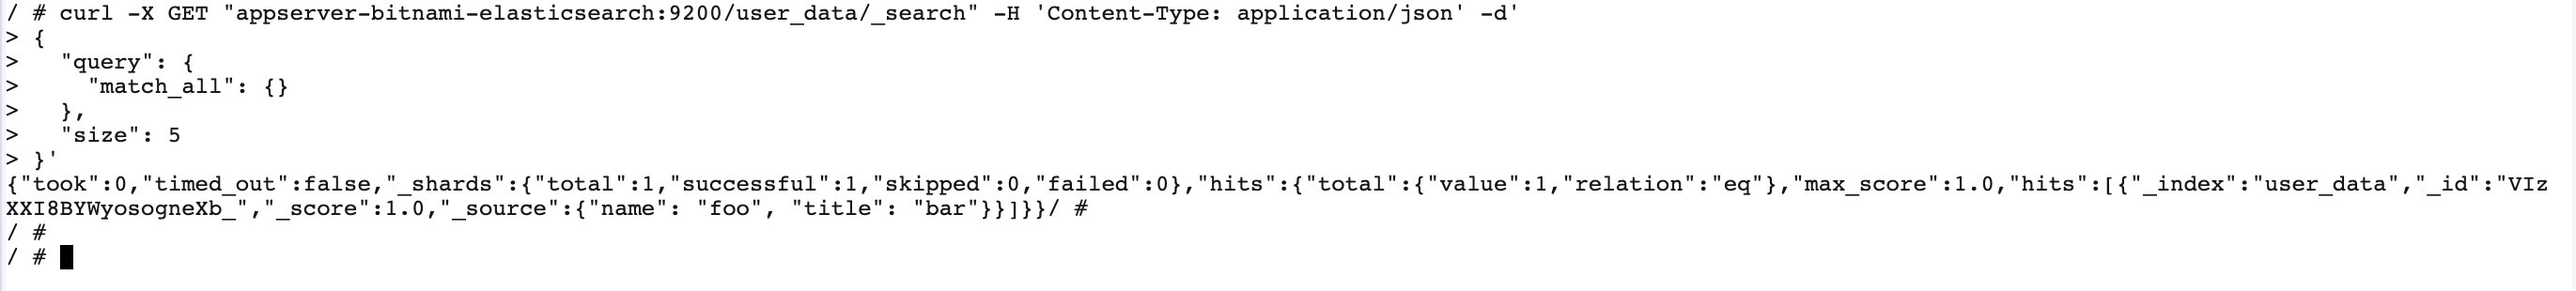
由此,可确定 ElasticSearch 基本部署完成,可供开发及测试环境使用。